How Much Do Sportsbooks Make? U.S. Betting Revenue Breakdown (2005–2024)
The sports betting industry in the United States has exploded in recent years, driven by the legalization of sportsbooks across dozens of states. While exact profits are often difficult to estimate, especially from offshore or illegal bookmakers, the best available data comes from state-regulated sportsbooks, particularly Nevada, which has reported consistent betting revenue data since before the 2018 repeal of the Professional and Amateur Sports Protection Act (PASPA).
In this guide, we’ll look at how much sportsbooks make, including:
- Total annual handle (amount wagered)
- Sportsbook profits year over year
- Average hold percentage by year and sport
- State-by-state sportsbook revenue comparisons
- Insights into trends, betting preferences, and emerging markets
Nevada Sportsbook Revenue: The Gold Standard for Transparency
Nevada remains the most transparent state when it comes to publishing monthly and annual sportsbook performance data. From 2005 to 2024, we’ve seen massive growth in both the handle and revenue sportsbooks earn. Even with new markets opening up, Nevada continues to serve as a reliable benchmark for profitability in the sports betting industry.
2024 Nevada Sportsbook Performance at a Glance
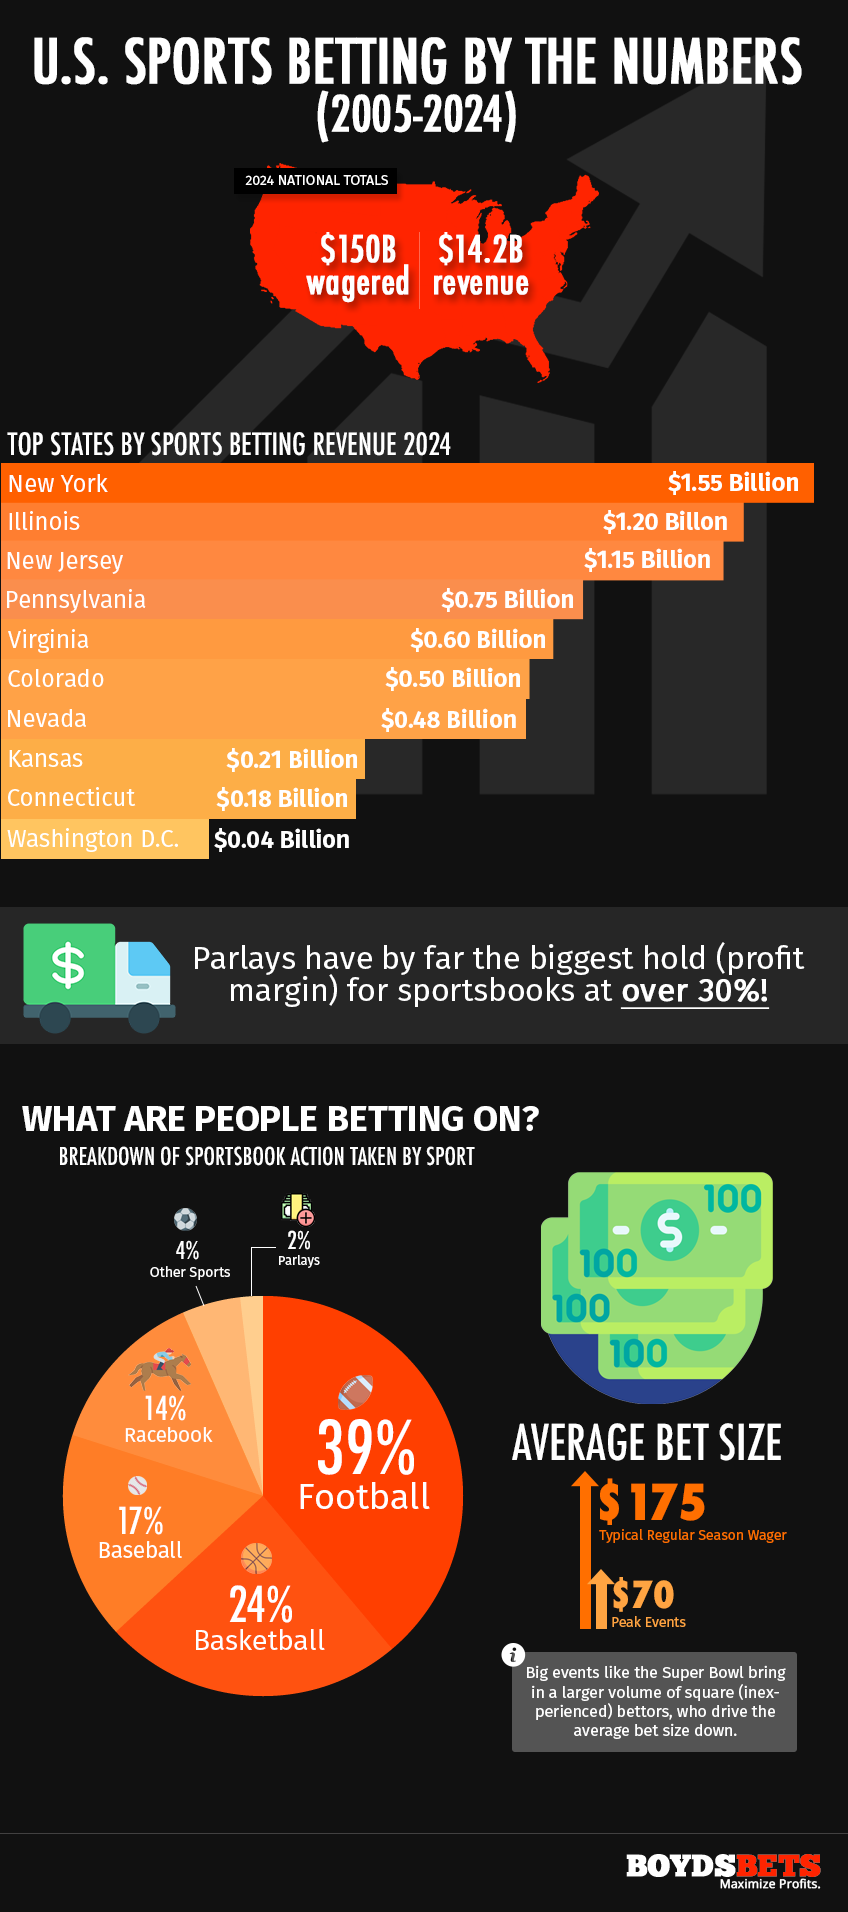
According to the Nevada Gaming Control Board, sportsbooks in the state handled a record $8.5 billion in wagers in 2024. That translated into $481.3 million in profit, for a hold rate of 5.66%.
Nevada Sportsbook Handle, Profit, and Hold (2005–2024)
The table below shows how Nevada sportsbook revenue has evolved over the past 20 years. The significant jump in Nevada sportsbook handle post-2018 (other than 2020, which was negatively impacted by Covid) can be largely attributed to the Supreme Court’s decision in Murphy v. NCAA, which struck down PASPA and removed federal barriers to sports betting across the United States.
Rather than harming Nevada’s established market, this ruling actually strengthened it in several ways: the nationwide normalization of sports betting created a broader customer base; Nevada maintained its appeal as a premier betting destination for major sporting events; sportsbooks gained the ability to market more extensively nationwide; operators invested heavily in improved mobile betting platforms to remain competitive; and established Nevada gaming companies leveraged their expertise to create synergies between their operations in multiple states.
This perfect storm of regulatory change and industry adaptation created an environment that dramatically expanded Nevada’s sports betting revenue despite new competition emerging in other states.
| Year | Handle | Profit | Hold |
|---|---|---|---|
| 2024 | $8.50 Billion | $481.3 Million | 5.66% |
| 2023 | $8.10 Billion | $450.2 Million | 5.56% |
| 2022 | $7.80 Billion | $430.5 Million | 5.52% |
| 2021 | $7.50 Billion | $410.0 Million | 5.47% |
| 2020 | $5.00 Billion | $250.0 Million | 5.00% |
| 2019 | $5.32 Billion | $329.1 Million | 6.19% |
| 2018 | $5.01 Billion | $301.0 Million | 6.01% |
| 2017 | $4.87 Billion | $248.8 Million | 5.11% |
| 2016 | $4.51 Billion | $219.2 Million | 4.86% |
| 2015 | $4.23 Billion | $231.8 Million | 5.48% |
| 2014 | $4.25 Billion | $278.99 Million | 6.57% |
| 2013 | $3.96 Billion | $255.32 Million | 6.44% |
| 2012 | $3.82 Billion | $224.45 Million | 5.87% |
| 2011 | $3.27 Billion | $200.29 Million | 6.13% |
| 2010 | $3.17 Billion | $213.41 Million | 6.74% |
| 2009 | $2.97 Billion | $202.50 Million | 6.82% |
| 2008 | $3.06 Billion | $216.99 Million | 7.08% |
| 2007 | $3.19 Billion | $262.62 Million | 8.23% |
| 2006 | $3.06 Billion | $288.01 Million | 9.40% |
| 2005 | $2.83 Billion | $225.51 Million | 7.98% |
Why Does Hold Percentage Matter?
The hold is arguably the most important stat for sportsbook profitability. A sportsbook can take billions in wagers (handle), but if it returns nearly all of that to players, profits can be minimal. Nevada’s average hold has hovered between 5% and 7% in recent years, which is sustainable and profitable over large volumes.
U.S. Sports Betting Revenue by State (2024)
Since the federal ban was lifted, dozens of states have launched legal sports betting markets. Many publish monthly revenue reports through their gaming commissions. Here are the other top U.S. states (with available figures) by total handle and sportsbook revenue in 2024.
| State | Handle ($B) | Revenue ($B) | Hold % |
|---|---|---|---|
| New York | $19.0 | $1.55 | 8.16% |
| Illinois | $14.0 | $1.20 | 8.57% |
| New Jersey | $12.8 | $1.15 | 8.98% |
| Pennsylvania | $8.42 | $0.75 | 8.91% |
| Virginia | $6.92 | $0.60 | 8.67% |
| Colorado | $6.10 | $0.50 | 8.20% |
| Connecticut | $2.18 | $0.18 | 8.26% |
| Kansas | $2.50 | $0.21 | 8.40% |
| Washington D.C. | $0.46 | $0.04 | 8.70% |
Which Sports & Bets Are Most Profitable for Sportsbooks?
Not all sports and wager types generate equal profit margins. Here’s a quick overview of which sports/types have the highest and lowest hold percentages in Nevada:
- Parlays: 30%+ hold, high risk for bettors, highly profitable for sportsbooks.
- Horse Racing (Racebook): 15%+ hold, especially with exotic wagers.
- Football: High volume, moderate profit. Often 4-6% hold.
- Basketball: Slightly higher hold than football, especially during March Madness when more amateurs participate.
- Baseball: Lower hold (3-5%), partly due to lower betting interest and moneyline pricing.
Sportsbook Revenue Trends
Across the board, U.S. sportsbooks are seeing:
- Consistent revenue growth year over year, even in maturing markets.
- High state tax revenue, with some states generating over $500 million annually from sports betting taxes.
- Mobile betting dominance: Over 90% of bets in states like New York and New Jersey are placed via mobile apps.
- Parlays and in-play betting continuing to drive margins higher.
U.S. Sportsbook Profitability
As more states legalize sports betting and expand online offerings, the profitability of sportsbooks will likely remain strong. That being said, increased competition, market saturation, and regulatory shifts could impact hold percentages and margins in the coming years. For now, the data tells a clear story: sports betting in America is big business, and the house is still winning.
Downloadable Infographic
We’ve created a custom infographic summarizing key sportsbook revenue data from 2005 to 2024.